
Tips for Using Data Insights
Get more out of Reports by comparing date ranges, filtering by venue, exporting figures, and matching revenue to bank deposits.
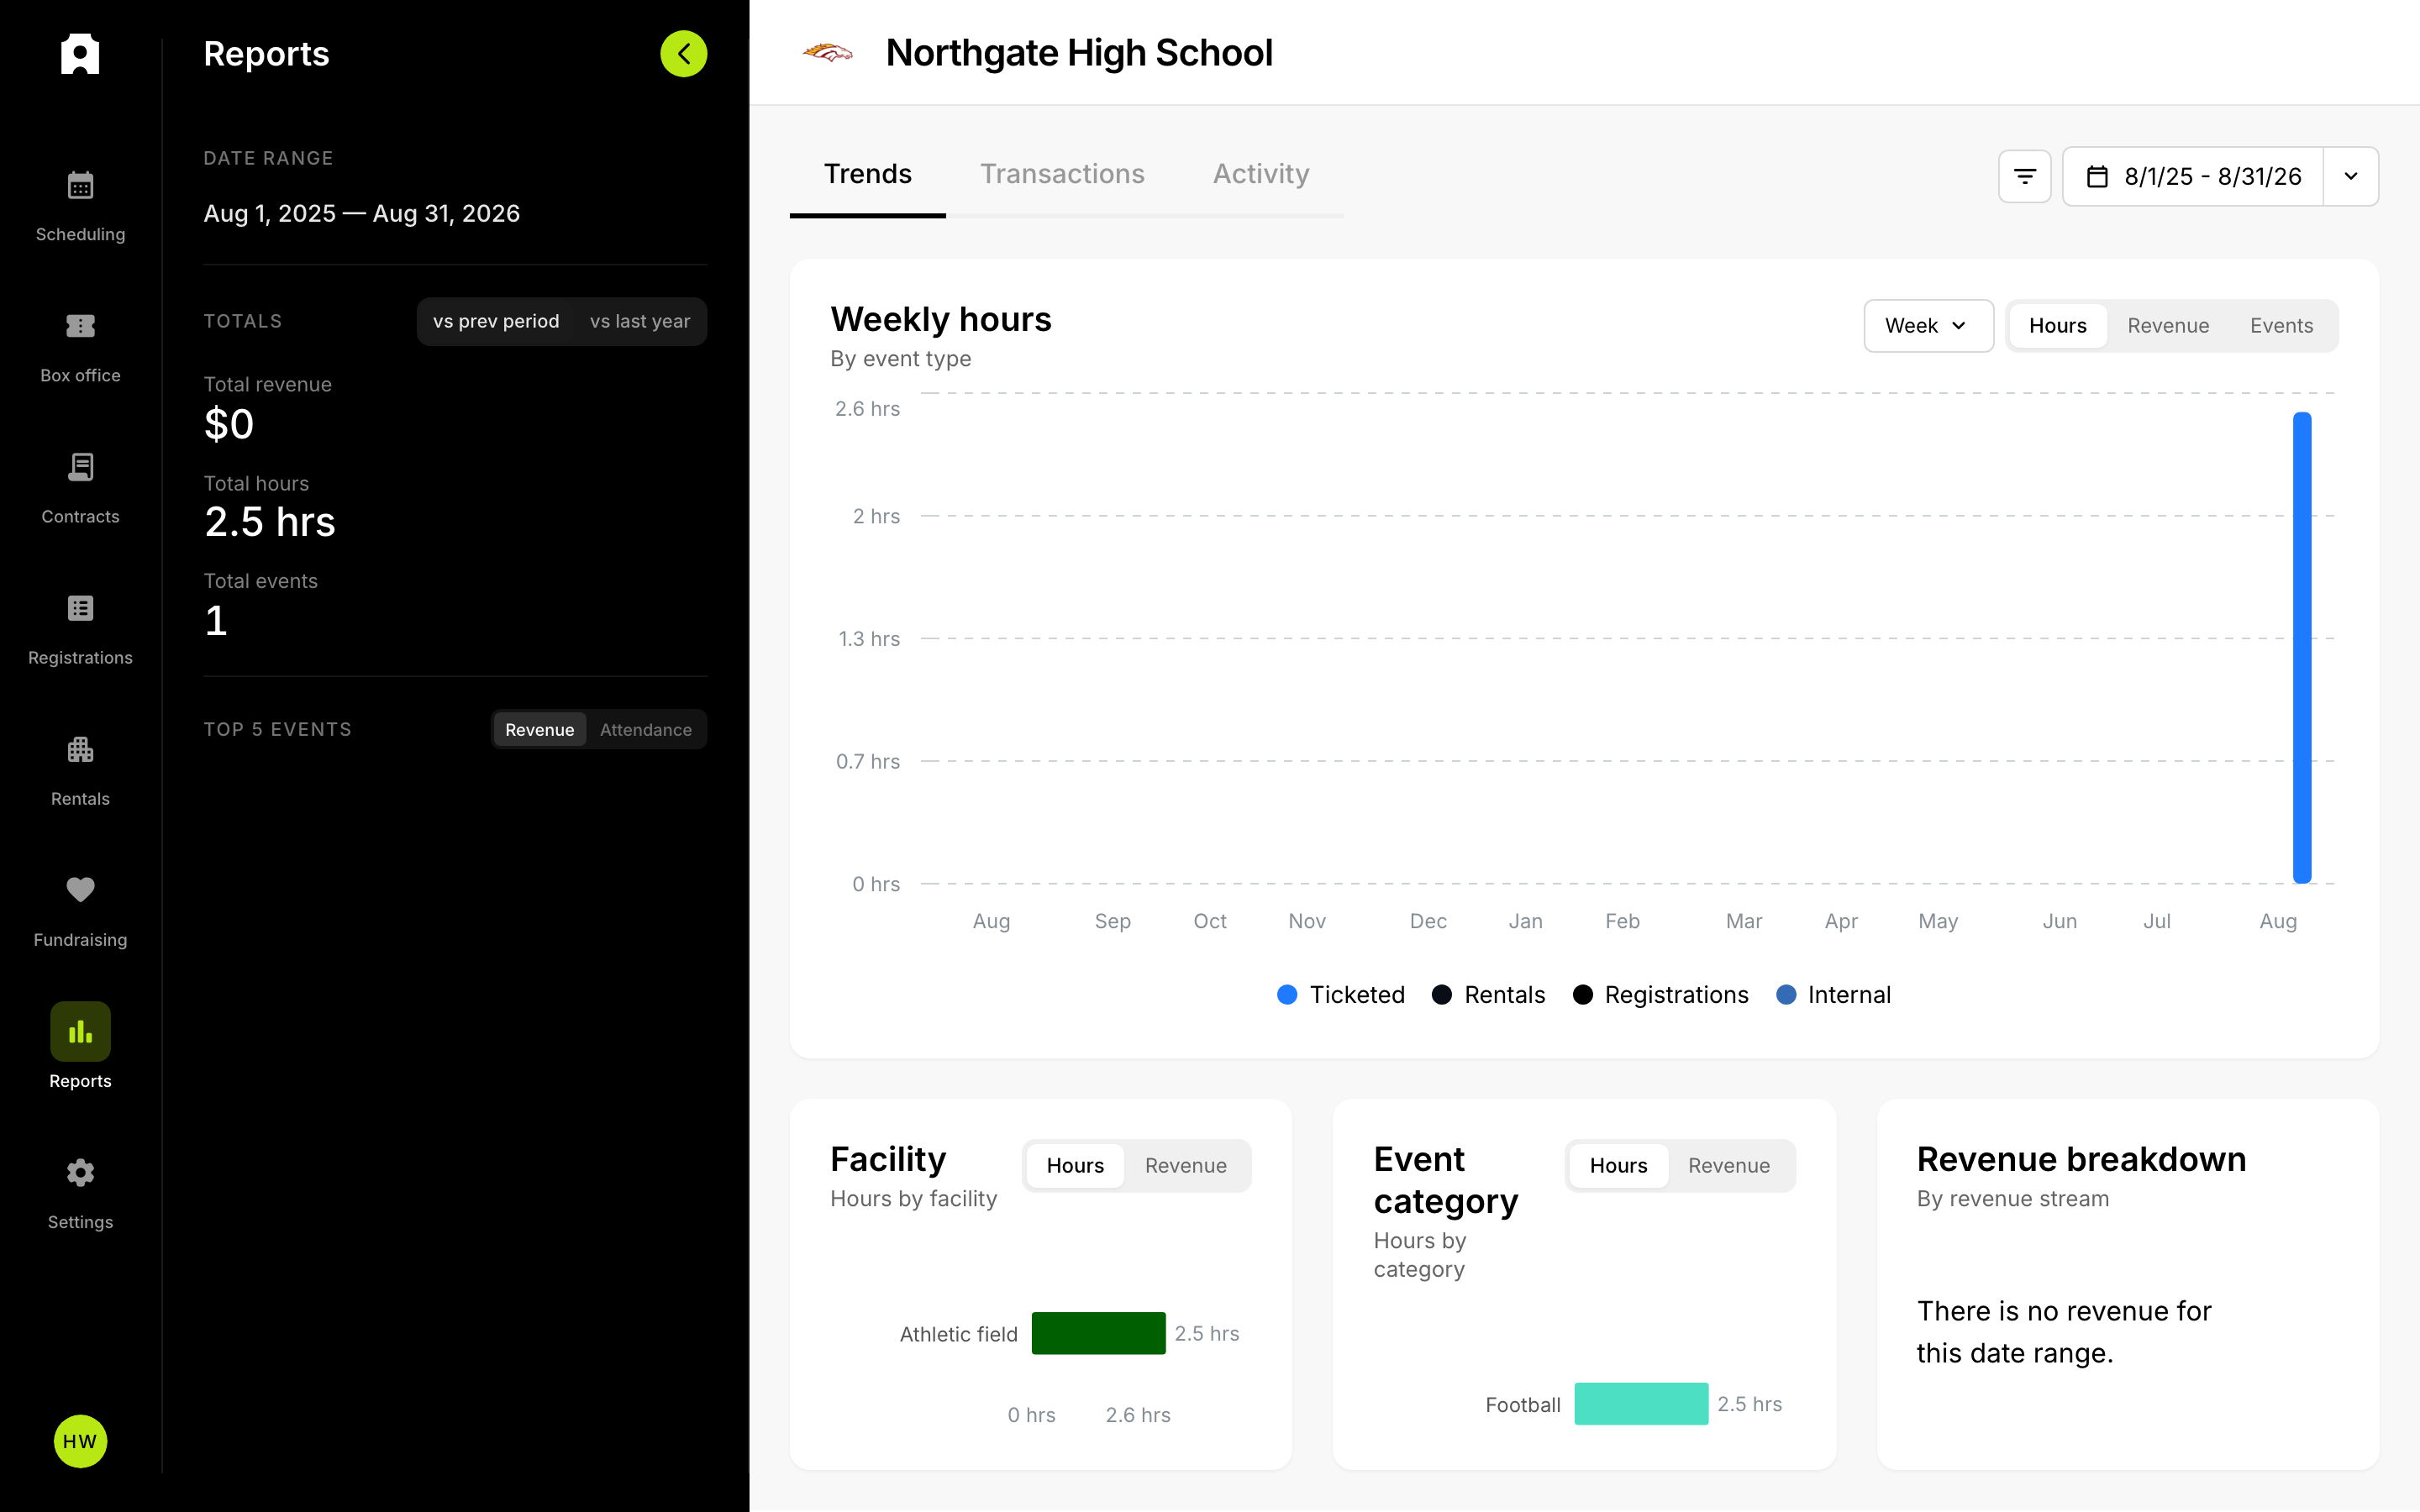 Data and insights in Reports.
Tips for Using Data Insights
After this article you will be able to compare one period against another, narrow the numbers down to a single venue, pull figures out into a spreadsheet for a board or finance meeting, and match what Admittee collected against what landed in your bank account. These are the habits that turn Reports from a page you glance at into something you can act on. For a tour of what each chart shows, see Understanding Analytics in Admittee.
Reports has two tabs you will use most: Trends, which shows totals and charts for a date range, and Transactions, which lists individual sales line by line.
Compare date ranges and seasons
Changing the date range is how you answer "how are we doing versus last time."
- Open the date range control at the top of Reports. You will see a calendar icon and the current dates.
- Select the small arrow at the right of the control to open the list of presets.
- Choose This school year and note the totals.
- Reopen the presets and choose Last school year to compare.
The same approach works for This month versus Last month. To pick any two dates yourself, choose Custom date range at the bottom of the preset list and select a start and end date on the calendar.
The school-year and fiscal-year presets follow the start month your institution has configured, so a season-over-season comparison lines up correctly instead of splitting one season across two calendar years.
Where a comparison is available for the period you chose, Trends shows a change indicator next to totals, so you can see the direction of travel without switching back and forth.
See what's working at a glance
- Use the Top 5 events list to spot your biggest draws. Switch between Revenue and Attendance — an event can top one list without topping the other.
- Use the Revenue breakdown to see which streams are actually driving income: tickets, passes (a pass is one ticket that admits someone to several events), registrations, donations, rentals, concessions and contracts. Select a stream to see which events contributed most to it.
- Switch the main chart to the Events or Hours metric to gauge how busy a period was, not just how much it earned.
Why does my fundraiser revenue show up under donations?
Ticket revenue tied to a fundraiser is grouped with donations in Reports. That is deliberate: it means a fundraiser's full impact appears in one place rather than being split between two streams. If you are comparing a fundraiser's result to what you collected, look at donations rather than tickets.
Focus on one venue
Apply the facility filter to isolate a single venue when you are evaluating how heavily it is used, or reporting to whoever manages that space. Every total and chart on the Trends tab, and the list on the Transactions tab, respects the filter.
One thing to watch: an event that uses more than one facility counts toward each of them. Per-facility totals can therefore add up to more than your unique event count.
Export for board and finance meetings
When you need the numbers outside Admittee, export a spreadsheet and drop it into your slides or budget documents.
- Export from Trends for summary tables and breakdowns.
- Export from Transactions for a line-by-line record.
Currency and number formatting carry through to the spreadsheet, so figures are ready to total or chart without cleanup. See Exporting Reports for the full steps.
Match Admittee revenue to your bank deposits
A payout, or deposit, is money Admittee has paid out to your bank account. To match Admittee revenue against a bank statement, work from the Transactions tab and use the Payout Date column. The sale date tells you when the money was collected; the payout date tells you the calendar date it reached your bank. Transactions still waiting to be paid out show as pending, so you can tell settled revenue apart from money still in transit.
-
Open Reports and select the Transactions tab.
-
Switch the tab to the deposit view. Transactions then show the date each payment reached your bank alongside the sale date.
-
Export the list to a spreadsheet.
-
Group the rows by deposit date. One group is one bank line.
-
Sum the Net column for that date. It should equal the deposit amount on your statement.
-
Export from Transactions, then group the exported rows by payout date.
-
Sum the Net column for that date. It should equal the deposit amount.
-
Treat refund rows as negatives. A refund is dated by the deposit it came out of, and the original sale row stays at its full amount rather than being reduced.
What if a deposit doesn't tie out to the penny?
Some card-processing adjustments are not listed as individual transaction rows — for example fraud-protection charges, in-person card reader fees, and disputes. If your sum is slightly off, open the Deposits view. It shows a statement for each deposit, grouped by category and item type, with fees, refunds and adjustments broken out so the total matches the bank figure.
Deposits that have not paid out yet appear as pending and show the amount only, without a full statement.
Related: Understanding Analytics in Admittee and Exporting Reports.